Showing posts with label evolution lab. Show all posts

Thursday, January 8, 2015

Chigozie's Wisconsin Fast Plant Mini Lab Report

Name:  Chigozie Amonu
The Effect of Artificial Selection on the Average Leaf Length of Wisconsin Fast Plants

Results:

The question that we attempted to answer in this lab was, “Does selection for average leaf length influence F1 phenotypes?” The null hypothesis for this lab was, “There is no significant difference between the mean of the P Generation (Pre-Selection) and the mean of the F1 Generation”. We gathered data in order to answer this question and reject, or fail to reject, this null hypothesis.

Calculations & Statistical Analysis:

Figure 1:  

We planted the P generation on Day 1 of this experiment, and on Day 9 we took measurements of the leaves of all 57 plants and averaged the leaf length of each plant. The histogram below (Figure 1) shows the distribution of the average leaf length in the P Generation of the plants. The mean of the average leaf lengths was 8.84 mm, and the median was 8.5 mm. These values were similar, so we could assume that the data was normally distributed. The calculated SEM was 0.45. The lower limit of the 95% Confidence Interval was 7.94 mm, and the upper limit of the 95% Confidence Interval was 9.74 mm. There was not a definite bell curve to the data that we collected, as seen in the histogram. We later used this data to conclude what we would manipulate during our artificial selection.
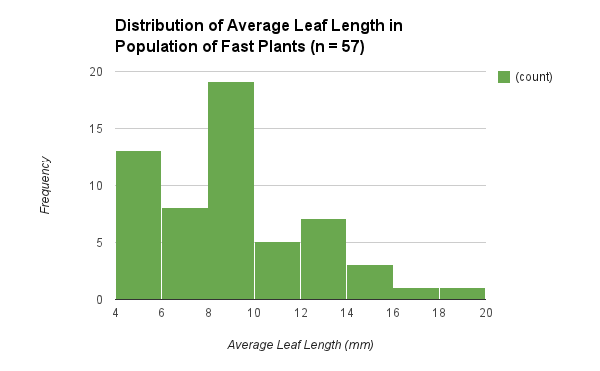
image (5).png

Figure 2:
After we gathered the data from the pre-selection P Generation, the class collaboratively decided to select for leaf lengths of 12 mm or greater. The leaves that did not meet this criteria were cut off. After this selection, 8 plants remained. This histogram (Figure 2) displays the data that we collected from the survivors of our artificial selection. We selected for leaf lengths of 12 mm or higher. Only 8 plants were left after this selection. The mean of these average leaf lengths was 13.88 mm, and the median was 13.75 mm. These values were similar, so we could assume that the data was normally distributed. The calculated SEM was 0.45 mm. The lower limit of the 95% Confidence Interval was 12.98 mm, and the upper limit of the 95% Confidence Interval was 14.78 mm. This histogram also does not display a bell curve with the data that we collected. After collecting this data, we expected the F1 Generation to have phenotypes similar to this post-selection P Generation since we purposely selected for a certain range of leaf lengths.
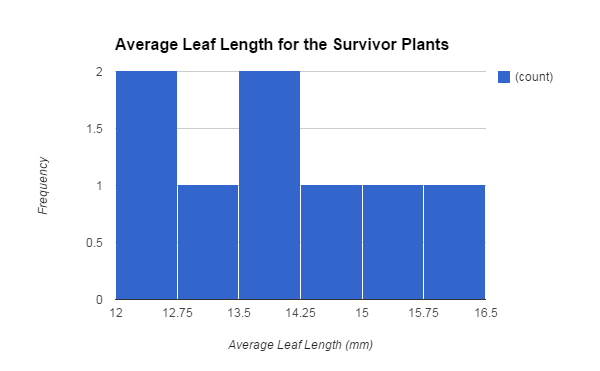
Figure 3:
After the post-selection P Generation fully grew and created seed pods, we planted the seeds from this group of plants. We then collected data from the offspring. This graph shows the average leaf length of the F1 plants. There were 33 plants in the generation. The mean of the average leaf lengths of the F1 plants was 6.46 mm, and the median was 6.33 mm. These values were similar, so we could assume that the data was normally distributed. The calculated SEM was 0.31 mm. The lower limit of the 95% Confidence Interval was 5.83 mm, and the upper limit of the 95% Confidence Interval was 7.09 mm. This graph is also in more of a bell curve, and the curve is shifted slightly to the left.
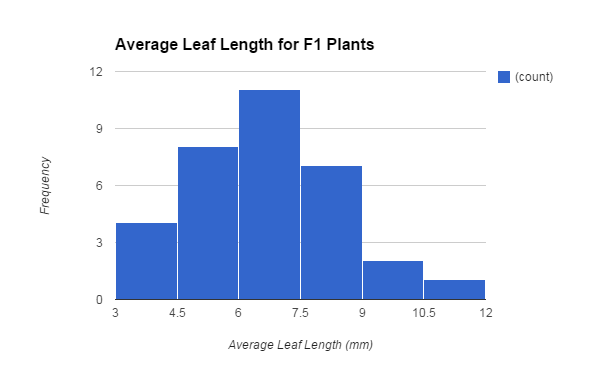
Table 1:

This data table shows the descriptive data that was collected during this experiment from the pre-selection P Generation, the post-selection P Generation, and the F1 Generation. Shown below is the sample size, mean, median, standard deviation, SEM, and the lower and upper limits of the 95% Confidence Interval.

DESCRIPTIVE STATISTICS - AVG. LEAF LENGTH OF WISCONSIN FAST PLANTS (mm)

P Generation
P Generation - Survivors
F1 Generation
Sample Size (n)
57
8
33
Mean
8.839181287
13.88
6.462121212
Median
8.5
13.75
6.333333333
Standard deviation
3.39196426
1.26
1.80735
SEM
0.4492766416
0.45
0.3146201419
95% CI Lower Limit
7.940628004
12.98
5.832880928


Discussion:

Conclusions:

In this lab, we attempted to perform directional selection. This selection would easily be seen in the histograms as the curves in the histograms would shift to the left or right. However, the 95% confidence intervals of the pre-selection P Generation do not overlap with the 95% confidence intervals of the F1 Generation. This allowed us to reject our null hypothesis, “There is no significant difference between the mean of the P Generation (Pre-Selection) and the mean of the F1 Generation”. There is a significant difference between the mean of the pre-selection P Generation and the F1 Generation. Overall, the artificial selection for average leaf length did not affect the F1 Generation.

Experimental Evaluation:

This experiment was carried out with a few errors that could have affected our data that we collected, and as a result our entire conclusion. There were different individuals measuring the leaves of the plants, so the different strategies of measuring could have created incorrect measurements. Also, some measurements and calculations were rushed due to lack of time, so errors could have been made in that aspect. One other error could have occurred from the lack of recording in some areas. For example, the number of survivors from the P Generation was only recorded by one individual, so if that record was wrong, then the whole lab is possibly thrown off. In spite of the possible errors, I am overall satisfied with the conclusion that we received from the lab.

Wednesday, January 7, 2015

Nida Ali's Fast Plant Mini Lab

Nida Ali
Analysis


In this class collaborative lab, we examined the effect on the average leaf length   plays on Wisconsin Fast Plants based off of artificial selection.
Primarily, a histogram was constructed to display the leaf length of our first generation plants. However majority of the leaf lengths were similar to one another, which thus did not formulate a bell curve graph for the parent population before selection (Figure 1). Then the artificial selection part of the lab began when we began to select for traits that are able to display a bell curve based on collected data. We then collected the average leaf length of each individual plant and constructed the histogram below. As depicted, this histogram clearly displays a bell curve based off the average leaf length per plant rather than each individual leaf length on a plant. On average the mean of the parent population was 8.8mm and the median was 8.5mm. Most of the leaf lengths of the plants fall in 4mm-10mm mark and the outliers fall after the 14mm mark. The histogram below displays a bell curve mainly because of the 95% Confidence Intervals that is 7.94 to 9.74, the standard deviation of 3.39 and SEM of .45.


Figure 1


After day 9, we began to look for variation among the plants. We selected for plants with the longest leaf length of 12mm long as our variable trait since it varies within range and kept those leaves alive, which ended up being just 8 plants. Leaves the were under 12mm were cut off and no longer remained in this artificial plant selection lab. As shown in the histogram below of the parent population after selection (Figure 2), the average leaf length of plants dramatically altered through augmentation. The parent population after selection histogram below does not present a bell curve, unlike the histogram of P generation before selection (Figure 1), which thus states that the average leaf lengths were similar in height. Majority of the plants had an average leaf length between 12mm to 14.25mm. As for the mean, the average increased from 8.8mm, before selection from the parent population,  to 13.88mm after selection. Likewise, the median also increased from before and after selection of the parent population from 8.5mm to 13.75mm. The standard deviation had a minor decrease from the P generation before survivors from 3.39 to 1.26, which thus displays that among the plants, not much change/variation was depicted. 
Once the parent population survivors reproduced, the difference seen among the mean and 95% confidence intervals were much closer to the parent population before selection rather than the parent population after selection. We calculated 95% intervals in order to see if the artificial selection process was done correctly. If the 95% intervals overlapped, the average leaf lengths were similar. In contrast, if the 95% intervals did not overlap, the average leaf length were not similar. The 95% confidence intervals were not similar either which highlights that the two do not overlap. In addition, the SEM value of 4.449 remained relatively the same to that of the P generation before survivors.
Figure 2
A proper bell curve graph was seen after my classmates and I took measured the average leaf lengths for each plant that was pollinated with beesticks. During this process, only a few plants survived, in which we based the histogram below off of. The F1 generation histogram (Figure 4)  displays a better bell curve more than but similar to that of the parent generation before selection. The medium of the average leaf lengths is 6.3mm and the mean averaged out to 6.5mm. The SEM was of 0.31 and the standard deviation was 1.81. The selection for the parent generation before selection influences the F1 generation due to the similar values seen in the means, 95% lower limit and upper limit. While comparing the 95% confidence intervals of the upper and lower limit of the parent generation of 7.9 to 9.73 to that of the F1 generation of 5.8 to 7.09, they do not overlap resulting in less similarity.

Figure 4


Discussion
Conclusion:
The null hypothesis that there is no significant difference is seen between the two means of the parent generation before selection and F1 generation is rejected. We reject the null hypothesis because there is a significant difference among the means due to the difference seen in the P generation before selection and F1 generation 95% confidence intervals. The 95% confidence intervals do not overlap, which thus states that they were not similar. Since the leaf length means of the P generation Survivors and Offspring generation are not similar, the artificial selection for the average leaf length does not influence the offspring generations. Through this experiment, I can conclude that the role artificial selection does not largely impact generations since the trait that is selected against may in fact be randomly passed down through generations.
A few limitations occurred during this lab experiment. One limitation is that not all of the planted seeds were able to grow, which thus resulted in several plants dying out and not participating in the experiment. Therefore, our results ended up being based off of 8 plants total. In addition, another limitation is that we did not regularly monitor our plants due to the lack of time, in most cases. We only monitored the plants once the next step in the lab was about to be conducted. Therefore, if we were consistent in monitoring our plants, possibly more plants would have been produced and not dried out due to any shortages either to light or water. If more plants were produced during this lab, accurate results would have been seen.

Experimental Evaluation:
Several errors conducted during this experiment may have altered the end result of this lab if they were addressed earlier. First and foremost, a huge error that was conducted was not exactly keeping track of the days. If we focused on what needs to be done mandatory on certain days, then I believe we would have accurate results. By going a few days here and there may not, at first, seem like a massive implication, but it may massively alter our results by allowing the plants to grow a couple of more days. One common error is not properly averaging the leaf lengths. In most cases, this may have to do with the shortage of time which resulted in students to quickly rush their math conducting process. In addition, another error that may alter the end result of the experiment would be accurately trimming the plants that were no longer needed in this lab.
Even though this lab was very time consuming, considering the few months that it took to fully conduct this lab, I felt that the results we received were still sufficient to an extent regarding minor errors.