Rana Srouji
The Effects of Artificial Selection on Wisconsin Fast Plants
Analysis:
Figure #1:
In order to observe directional selection, we tested a group of Wisconsin fast plants to see if selection for the average leaf length would influence the later generation phenotypes. The null hypothesis for this lab is that there would be no significant difference between the means of the parent generation, and the offspring (F1) generation.
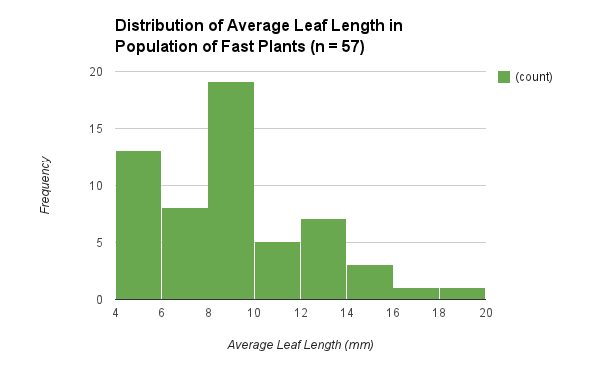
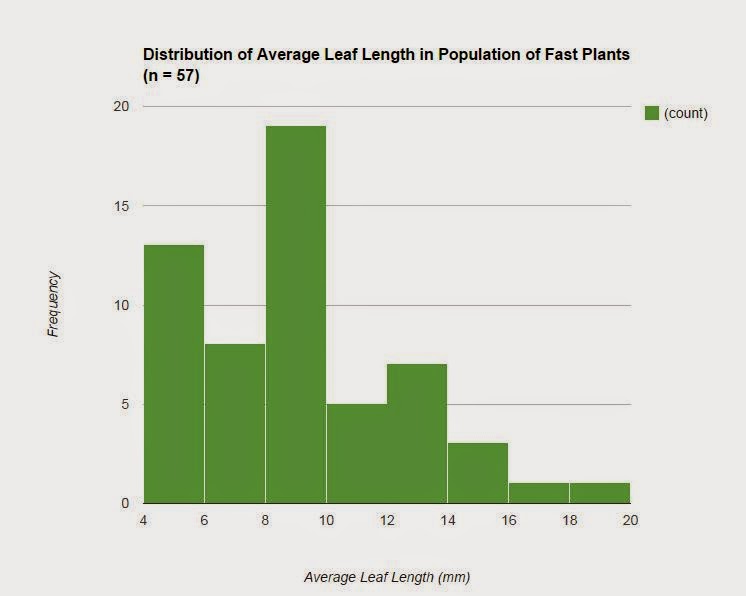
We began the experiment by growing the plants, and after 9 days we took the measurements of the leaf lengths on each plant, and calculated the average leaf length per plant. This population of fast plants is the parent population which consisted of a sample size of 57 plants. The graph of the data collected for this population is represented in a histogram which specifically shows the distribution of the average leaf lengths (Figure 1). The histogram does not show a bell curve because the data is not perfect. On average, the mean for the leaf length is about 8.84 mm and the median is 8.5 mm. Most of the plants fall around the 4 mm to 10 mm average leaf length range, while there are a couple of outliers because some plants had really long leaves. The leaf lengths ranged from about 4 mm to about 20 mm. The calculated standard deviation is about 3.39 and the SEM is about 0.45. The lower limit of the 95% confidence intervals for the data is rounded to 7.94 while the upper limit of the 95% confidence intervals for the data is rounded to 9.74.
 |
| Figure 1 |
Figure #2:
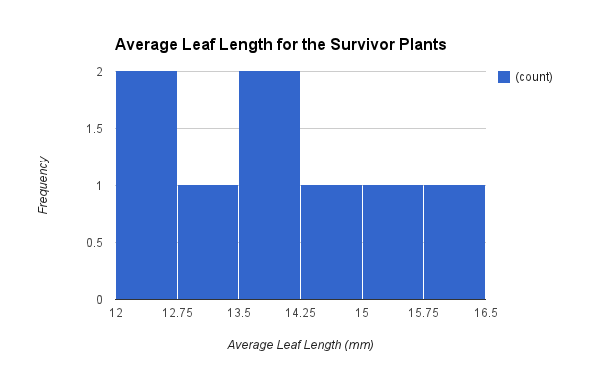
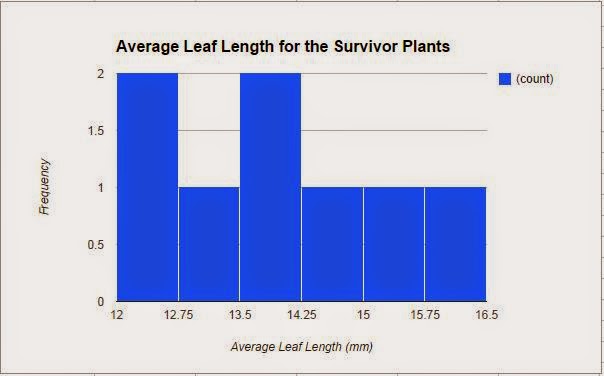
Afterwords, to apply a selection pressure on the population, we selected for plants who had an average leaf length of 12 mm or greater. Those plants who had shorter leaves were cut off and could not reproduce. Only 8 of the plants survived the selection and we collected the data for these plants, which is also represented in a histogram, that shows the average leaf length for the survivor plants (Figure 2). Similar to the previous graph, it is not a bell curve. The data ranged from average leaf lengths of 12 mm to about 16.5 mm. This difference in the leaf lengths would cause the mean of the leaf lengths to be higher than in the parent generation. On average, the mean leaf length for the survivor plant generation is 13.88 mm and the median is 13.75 mm. Most of the plants had an average leaf length from 12 mm to 12.75 mm and from 13.5 mm to 14.25 mm. The calculated standard deviation is 1.26 and the SEM is 0.45. The SEM stayed relatively the same throughout both populations. The lower limit of the 95% confidence intervals for this generation is 12.98 while the upper limit is 14.78.
 |
| Figure 2 |
Figure #3:
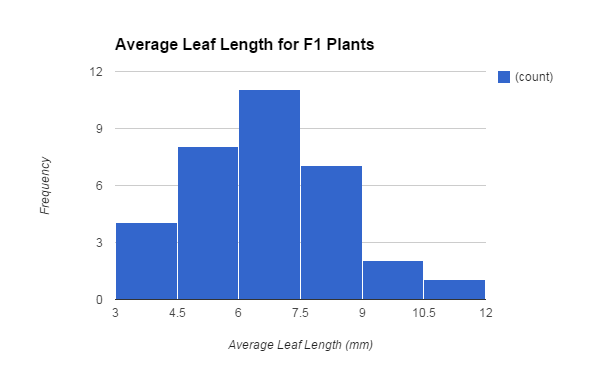
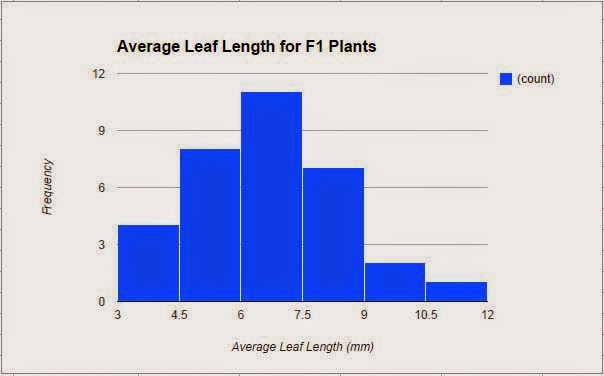
Lastly, after the survivors had fully grown, we took out the seeds from inside each of their pods, and planted them for the offspring generation. Once the offspring, otherwise known as the F1 plants, grew, we collected data which is shown in a histogram of their average leaf lengths (Figure 3). This final graph does show a bell curve of the data with the curve shifted a bit towards the left, and the least frequent average leaf lengths lie on the ends. The total amount of plants in this generation is 33 and their data ranges from average leaf lengths of about 3 mm to about 12 mm. Most of the plants had an average leaf length that lied in the range from 6 mm to 7.5 mm. The mean leaf length is about 6.46 mm and the median is about 6.33 mm. The standard deviation is about 1.81 and the SEM is about 0.31. Similar to the survivor generation, the standard deviation is much lower than the parent generation. The lower limit of the 95% confidence intervals is about 5.83 and the upper limit is about 7.09. These confidence intervals do not overlap with the confidence intervals of the parent generation before the selection.
Lastly, after the survivors had fully grown, we took out the seeds from inside each of their pods, and planted them for the offspring generation. Once the offspring, otherwise known as the F1 plants, grew, we collected data which is shown in a histogram of their average leaf lengths (Figure 3). This final graph does show a bell curve of the data with the curve shifted a bit towards the left, and the least frequent average leaf lengths lie on the ends. The total amount of plants in this generation is 33 and their data ranges from average leaf lengths of about 3 mm to about 12 mm. Most of the plants had an average leaf length that lied in the range from 6 mm to 7.5 mm. The mean leaf length is about 6.46 mm and the median is about 6.33 mm. The standard deviation is about 1.81 and the SEM is about 0.31. Similar to the survivor generation, the standard deviation is much lower than the parent generation. The lower limit of the 95% confidence intervals is about 5.83 and the upper limit is about 7.09. These confidence intervals do not overlap with the confidence intervals of the parent generation before the selection.
 |
| Figure 3 |
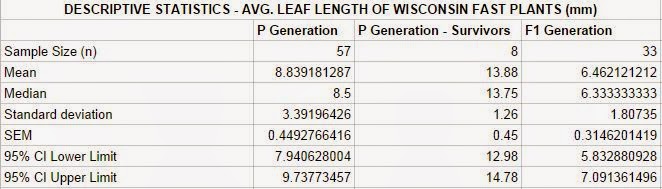
Table #1:
The collected data was calculated and configured in this data table (Table 1). It shows the sample size, mean, median, standard deviation, SEM, and confidence intervals for all three generations of fast plants.
The collected data was calculated and configured in this data table (Table 1). It shows the sample size, mean, median, standard deviation, SEM, and confidence intervals for all three generations of fast plants.
 |
| Table 1 |
Discussion:
Conclusions:
Natural selection is the process in which organisms that are better adapted to their environment survive and produce more offspring in comparison to those who are not. One form of natural selection is directional selection, which favors one extreme phenotype, in a population of organisms, over the mean and other extreme, causing the allele frequencies of the later generations to shift in the direction of that phenotype. This is usually best seen in graphs of the population over time, since directional selection will cause the original bell curve to shift either farther to the left or right. Also, it is helpful to look at the standard deviation of a population because it tells how far the measurements are spread out from the average/mean, and the lower the standard deviation is, the closer most numbers are to the average, while higher standard deviation means that numbers are spread out.
For this we grew plants and in the parent population, we cut off plants with leaf lengths that are less than 12 mm in length. Using the data and graphs from the parent population, the survivor population, and the offspring population, we were able to reject the null hypothesis which stated that there is no significant difference between the means of the parent generation and the offspring (F1) generation. Since the confidence intervals of the two generations do not overlap, this means that there is a significant difference between the means. We used the parent and offspring generations to compare confidence intervals, which show the mean leaf length for each generation +/- two times the standard error of the mean. Ultimately, selection for the average leaf length does not influence the offspring generations in this population because as seen in the above data, the mean leaf length in the survivors are not similar to the means of the offspring.
Though we received a result, there were some limitations in our experiment that could have altered our outcome. For example, many of the seeds that were originally planted either did not grow or died before the selection process began. Those that died could have contributed to the amount survivor plants.
Experimental Evaluation:
The lab was not carried out to the best of our abilities, and this could have also altered the outcome of the experiment. There were errors that could have been prevented, but got into the way and we had to work around them. Such as, time management with the fast plants. Either we were not able to go visit the plants in order to check their progress, or we ran out of time to do so. The time set for the parent population to grow before the selection, was extended due to the planning. This could have altered the length of the leaves since they were given more time to continue growth. To have prevented this, we could have been more organized with our time. Human error may have also acted as a large factor in the results that we came with at the end of the lab. The leaf lengths that we determined for our measurements could have easily been misread considering each of us were measuring with large rulers compared to the small size of the leaves. This would have affected our data collection which is used to reject or fail to reject the null hypothesis. Using smaller tools to measure length may have prevented this.
Even though the experiment results may have had multiple errors along the way, I still have some confidence in them. Many labs and experiments have small errors that could not be seen ahead of time. The only way to check if the results were accurate is to either have other groups try to do the same procedure and carry out the experiment to see if their results match up with ours; or to repeat the procedure ourselves.